Unity SDK Graphs
Unity SDK Output
Cognitive Load Graphs
Graph 1: Cognitive Load Status over Time
This graph visualizes a 10-minute task recording eye tracking data from the HarmonEyes Unity SDK with cognitive load output. Over the course of the 10 minutes, it is shown in the graph below a stepwise increase from a LOW cognitive load state during the first 2 minutes to a MODERATE level. The user stays at a MODERATE level during minutes 2 through 5 and increases to a HIGH cognitive load state after 5 minutes until the end of the task.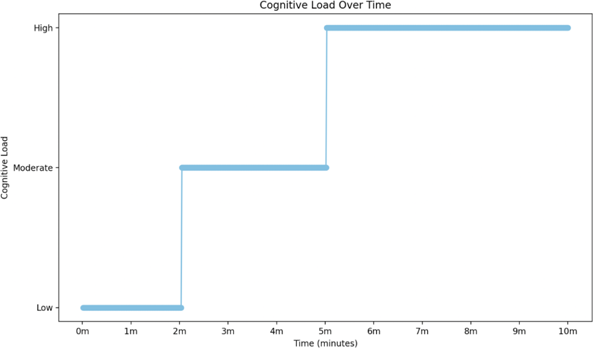
Graph 2: Cognitive Load Status with Time Predictions
Graph 2 depicts the same data as graph 1 with additional lower bound and upper bound timing windows from the LOW to MODERATE transition and MODERATE to HIGH transition. The upper and lower bound represent +/- 1 std from the RSME respectively. Additional information on these windows and the RMSE can be found here – Cognitive Load Model.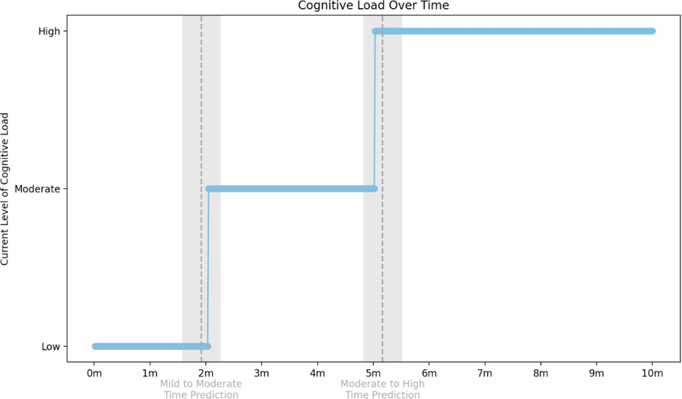
Unity SDK Output
Fatigue Graphs
Graph 1: Fatigue Status over Time
This graph visualizes a 10-minute task recording eye tracking data from the HarmonEyes Unity SDK with fatigue output. Over the course of the 10 minutes, it is shown in the graph below a stepwise increase from a LOW fatigue state during the first 2 minutes to a MODERATE level. The user stays at a MODERATE level during minutes 2 through 5 and increases to a HIGH fatigue state after 5 minutes until the end of the task.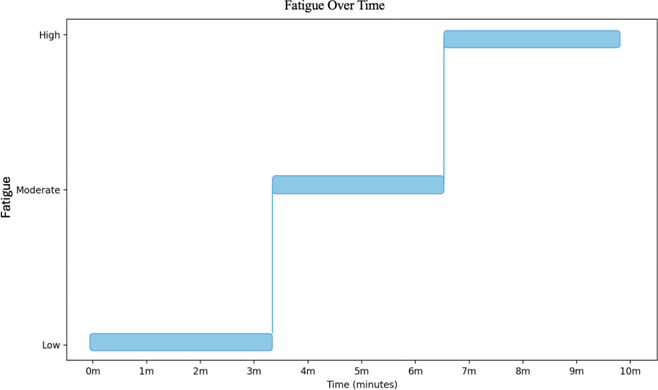
Graph 2: Fatigue Status with Time Predictions
Graph 2 depicts the same data as graph 1 with additional lower bound and upper bound timing windows from the LOW to MODERATE transition and MODERATE to HIGH transition. The upper and lower bound represent +/- 1 std from the RSME respectively. Additional information on these windows and the RMSE can be found here – Fatigue Model.